work/stealth/block-explorer

Making a new blockchain readable

A stealth startup was building a new blockchain. The team's focus was the network, and the UI was in the hands of an outside team. I was the only designer. This is how the design work moved from Figma files to a working prototype, and then to a working product.

role
Solo designer, with a PM
timeline
1 year
delivered
Explorer, wallet, coded demo
tools
Claude Design, Claude Code, Figma
prototype / application_map

Company name, branding and token names blurred under NDA.

01 / the_setup

A network-first startup, with a UI to figure out.

The startup was back-end heavy, and for a good reason: building the network was the hard part. The explorer and the wallet went to an outside front-end team. I was the only designer, working with the PM.

a typical explorer
  • Internal0x7a…f72a → 0x2c…d104120 USDC
  • Internal0x2c…d104 → 0x91…0b3e4.95
  • LogTransfer(addr,addr,uint)
  • LogSwap(uint256,uint256)
  • TokenUSDT, separate row8.00
  • LogApproval(addr,addr,uint)

A flat list. You rebuild the story in your head.

this explorer User A0x…01 holdertreasury B0x…02 swap</> C0x…03 holder mint +340 USDC −8 USDT 12345
  1. 1A flow graph, not a list
  2. 2Entities that hold components
  3. 3Several tokens on one graph
  4. 4A pinned layout that never jumps
  5. 5Down to the payload and code

It wasn't a simple UI. A typical explorer shows a flat list of logs. This chain needed a graph: traces, entities that hold components, and several tokens moving in one flow.

02 / the_gap

Detailed Figma files weren't enough.

I've worked with outside teams before. But this product had graphs, live data and a back end that was still being built, and it quickly became clear that the complexity wasn't getting across in offline work and quick weekly meetings.

The Figma files were as detailed as I could make them. Still, it took the team a long time to turn them into something usable for demos. Even mock data was a problem: they didn't know what to invent to test the UI.

// the gapWhat we kept asking for was "show us the graph at scale": mock data that challenges the UI and looks like the real thing, close to what users would actually see.
Figma logoFigma01 · first design pass
figma / transaction_graph
Early Figma design of the transaction graph: static boxes connected by labeled arrows.
My first pass in Figma, before development: a static picture of one flow, still called "Transaction".
Front-end team02 · outside build
first_build / trace_graph
The trace page as an outside team first built it: a mostly empty white page with a hash, an empty balance table and a graph of two boxes.
The first build, by an outside front-end team: the same trace, shown as two boxes. The data was there, with nothing to help you read it.
03 / the_switch

So the prototype became the spec.

I moved the design into Claude Design. Claude did a great job exactly where the outside team got stuck: realistic data. With the PM, we could just ask to see the graph at scale, instead of waiting for someone to understand what that means and invent the data.

Once a week we sat together and went through the working prototype. It was much easier to challenge the thinking, and the product, when everyone was clicking the same thing.

// what changedThings that used to take weeks, sometimes months, now took a week.
Claude Design iconClaude Design03 · playable prototype
prototype / trace_graph
The same flow as a working prototype: group it, replay it, open a node. Now called "Trace".

We started moving fast. Instead of planning months for a lean first release, we realized we could build several versions in parallel, and even move ahead on road map ideas, like AI agents that help users trade on the chain.

04 / decisions

Decisions we made by playing with it.

We knew from day one that a trace needed a graph. What it should show, and what it should hold back, took most of the time. Seeing it at scale is what settled it.

// the ruleGroup by default. Detail on click. Everything else in a drawer.
trace / message_flow
Close-up of the trace graph: an account card holding its components, connected to swap, fee collector and holder accounts grouped by application, each edge labeled with amounts.
Calls grouped by account and application, with a pinned layout so the same trace always looks the same.

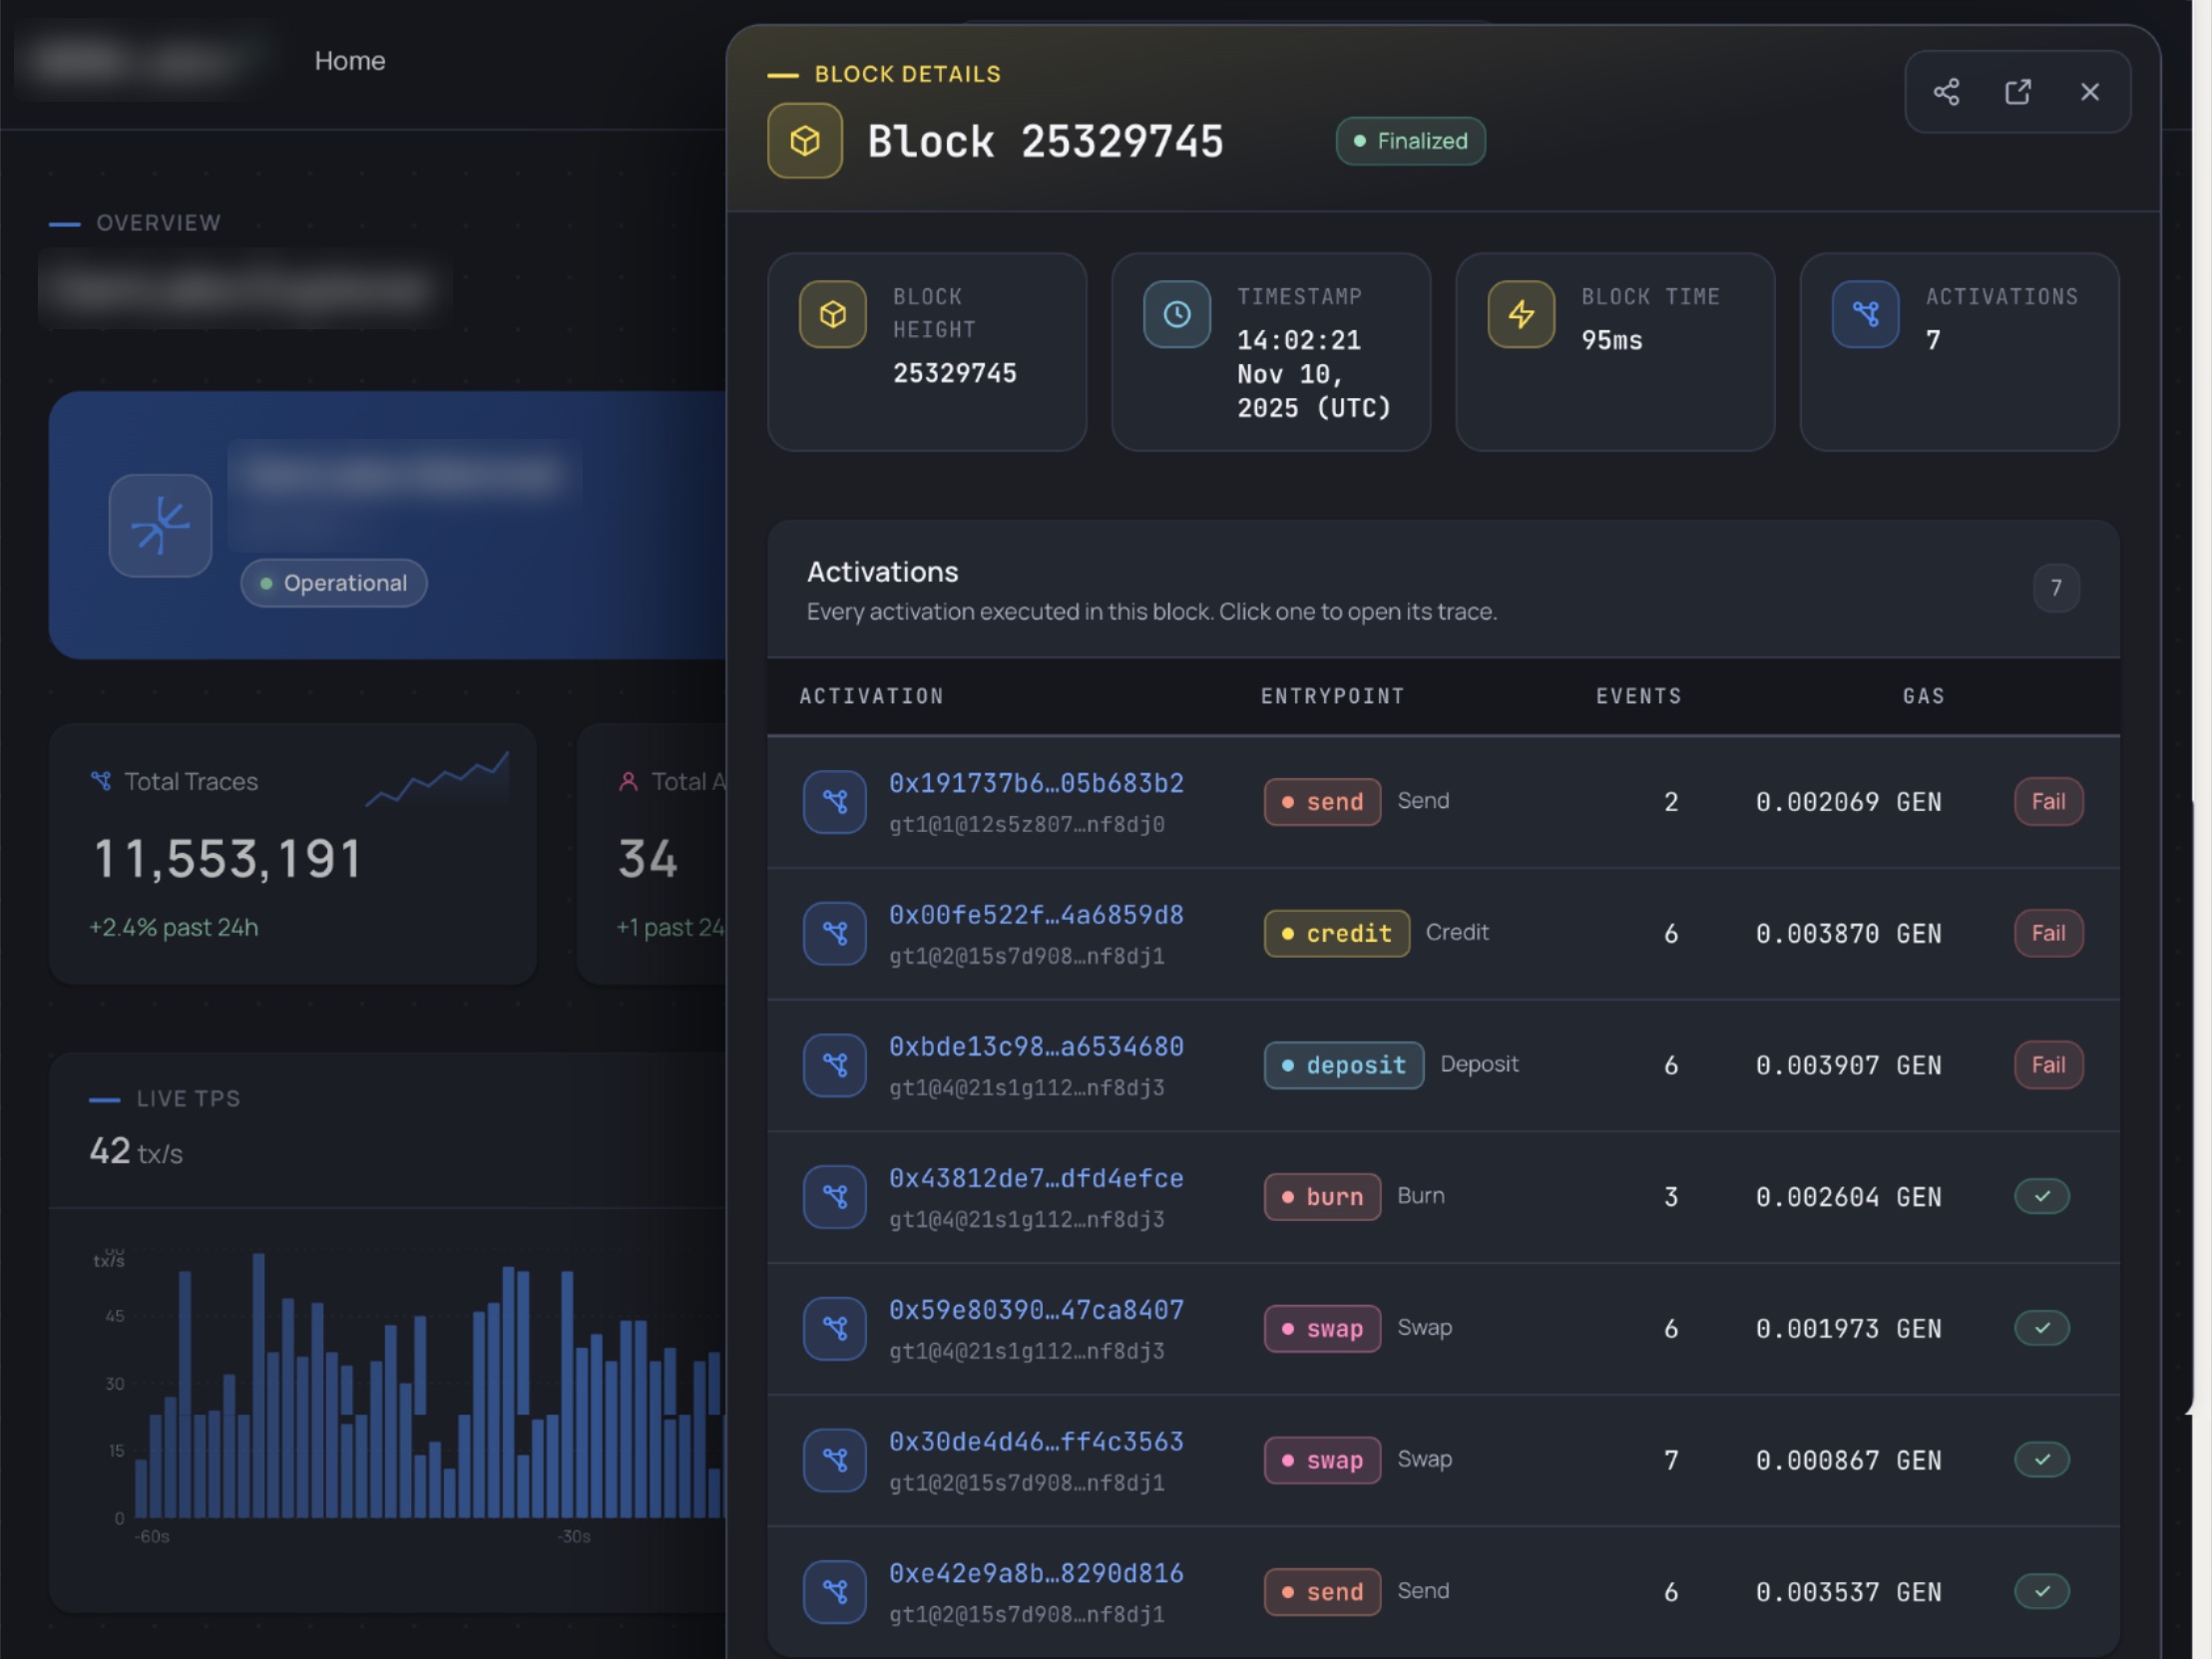
A drawer, not a new page. Clicking a block, a trace or a node opens its details next to what you were looking at. You keep your place in the graph, and still get every field.

explorer / block_drawer
Block details open in a drawer beside the explorer overview: block height, timestamp, block time and every activation in the block.

Trace

One complete transaction, and everything it triggered.

Activation

A single component call inside a trace.

Entity

An account: a person, a service or an agent.

Component

A smart component installed on an entity.

The chain came with four new terms. Every page opens with a one-line definition, in that term's color. And as the product grew and we demoed the prototype to more people on the team and to partners, the product managers renamed "Transaction" to "Trace" everywhere.

explorer / explainers
What is a trace? explainer box in blueWhat is an activation? explainer box in orangeWhat is an entity? explainer box in pinkWhat is a block? explainer box in yellow
The explainer box for each primitive, in its own color
05 / building_it

Then I started building, almost by accident.

It started as play. I didn't realize I was building, I thought I was just designing with Claude Design and Claude. I knew about the hype, I knew it was a powerful tool, and I wanted to be part of it.

Slowly I understood it could do much more than anyone on the team expected. In about two weeks I learned, experimented, got things wrong, fixed them, and delivered a working explorer to the product team for feedback. We were in different time zones and worked partly offline, and it was still fast.

01

Scaffold

React, TypeScript and Vite, from an empty folder

02

Brand → tokens

Claude read the brand book PDF

03

Pages + data

Six routes, charts, realistic traces

04

Preview & build

Run locally, check in the browser

05

Into Figma

Design and code side by side

block-explorer/repo
.claude/launch.json   local preview
DESIGN.md             tokens, routes, naming
src/
  pages/   Overview  Traces  TraceDetail
           Blocks  BlockDetail  NotFound
  components/
  data/mockData.ts    network-shaped data
tailwind.config.js
DESIGN.mdquoted from the repo
## Naming Convention

The product term for a transaction
is **Trace**. All user-visible text
uses "Trace" / "Traces". Internal
TypeScript types retain `Transaction`
to avoid a full data layer rename.
what_it_built · explorer + wallet
explorer / overview
Overview: network health, live throughput, latest traces
explorer / block
Block: every activation in the block, linked to its trace
wallet / dashboard
Wallet: balance, send, recent activity
Wallet: same tokens, tables and chips as the explorer. Click any screen to zoom.
06 / outcome

Acquired before launch.

The working explorer was shown to partners, investors and internal teams. Later, another development team joined. It took them a little while to realize most of their work was already done :)

The company was acquired before the product reached end users, so there are no usage numbers here.

// the resultWorking with Claude made development faster, and the build matched the design more precisely.
Shahar is highly professional, incredibly sharp, and has an impressive ability to quickly understand complex products and turn ideas into thoughtful, high-quality designs.
UEUri EdenProduct Manager
Shahar brings real clarity and structure to the design process, consistently bridging the gap between high-level business goals and technical constraints.
RARam AkukaProduct Management Leader
07 / takeaways

What was hard about the new way of working.

[01] versions

Splitting the work

It took me a while to learn how to split it into versions, so ideas from one didn't leak into another.

[02] system

Keeping one design system

Moving this fast made it easy to drift. Keeping every version on the same system took discipline.

[03] latest

One source of truth

With several versions running, making sure everyone looked at the latest one was a job of its own.

[04] feedback

Comments on the work

Comments couldn't sit on the prototype, so they moved back to Figma. Next time I'd want them pinned to the spot.

The explorer was the project. Learning a new way to work while the tools were changing was the real story.